

According to internal surveys, the average dealer has about 12 portals that they’re visiting on a daily basis. With this combination of vendors and tracking systems it seems like every tool that we utilize in the dealership is comprised of a dashboard and reporting of some sort. If that’s your reality, then the question is, what data makes the most sense or helps you move the needle?
For us at DTVMS, we believe that data should be compartmentalized into a few different segments that will clearly showcase areas of deficiency within your operation.
Marketing Initiatives
- User activity
- Unique user activity
- Leads
BDC Performance
- Lead response time
- Appointments
- Set, show, sold ratios
Inventory
- Frontline Units
- Inventory aging
Lost Opportunities
- Lost opportunity
- Bought elsewhere
Benchmarks and Goals
Now, before we get into a breakdown of each one of these areas, there are two critical elements that are required for you to be able to utilize the data effectively. The number one requirement you need is to set a benchmark. DTVMS recommends going back at least three years to figure out your averages for all the above segments. Adding benchmarks allows you to measure where you currently are in relationship to where you have been.
In the same token, you should create a goal metric for each one as well.
This will allow you to move in the direction of growth. Remember “we must inspect what we expect”. If we don’t have a target, how can we achieve it? It’s not enough to just say I want to sell more cars–that’s a given–you have to have goals for each one of these segments in order for you to truly start to see increases in overall performance.
Now, let’s talk about the different segments.
Measuring Marketing Initiatives
Measuring automotive marketing initiatives is visualized through website traffic, users versus unique users, leads and lead response time. When it comes to digital marketing (and I mean digital marketing alone) there is only three ways to really measure the effectiveness of those initiatives:
- Impressions
- Views
- Leads
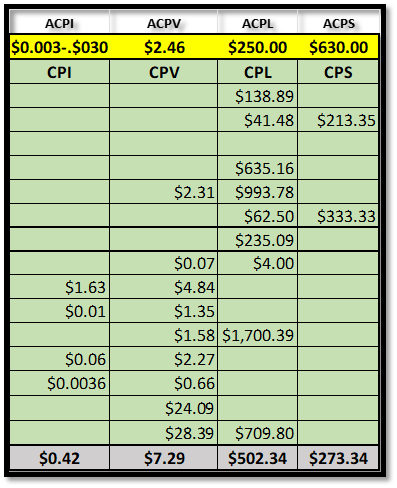
We overcomplicate things when it is truly about simplicity, and with your benchmarks and goals you can see your progress on a weekly basis. By knowing your cost per impression, per views and per leads you will know which providers are offering you the best quality or the best ROI, then you can effectively maneuver your providers to generate more results.
BDC Performance
If marketing is the message, then your BDC department is the answer to that message and should be tracked accordingly. To effectively track your BDC you need to be in there with your managers—listening to the conversations and learning their internal processes.
BDC metrics are complicated and often times tracked outside of the CRM with internal spreadsheets created by the department for the department. To fully understand the way your marketing message is being answered decision makers within the dealership need to know how to interpret this data.
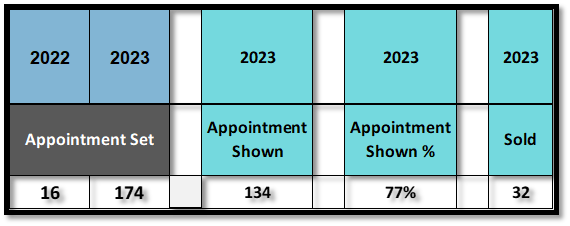
Whether it be inbound leads or outbound equity mining, your BDC’s set, show, sold lead conversion ratios are a clear indicator of performance. Adding these to your weekly data conversations is another way to proactively control overall marketing success.
Example:
If you have a high set to show percentage–80% or higher–chances are your BDC department is not taking enough risks. There is no ‘push’ happening. An agent with a high show rate is more than likely setting appointments for people they are already confident will show up, they are ‘order taking’ and the dealership is losing opportunities. Another way to track BDC performance is based on the sold rate. Often times BDC’s will say that they do not have control over the sold and therefore should not be held accountable for the sold rate.
While this argument holds some merit, the metric for sold conversion is still useful to illustrate the effectiveness of the conversations the BDC is having with customers. A sold rate outside of industry standards and significantly lower than a show rate (80% show with a 25% sold) may indicate a breakdown in scripting.
Leads and response times also come into play in this equation. A lead response time of more than five minutes can indicate a myriad of other process breakdowns including (but not limited to) too many leads and not enough agents, a CRM process breakdown, mismanagement of BDC employee scheduling, etc. A quick response to your customers is one of the easiest changes you can make when pushing the needle.
Customers are everywhere, and you need to be everywhere as well.
Remember, we are in a digital age. The attention span of a customer is very short-lived. And if we do not answer those leads quickly our closing percentages will significantly drop. Our chances of even getting an appointment will significantly drop. Again, setting benchmarks and goals for these categories is a must. You need to understand where you’ve been and where you’re going.
Inventory
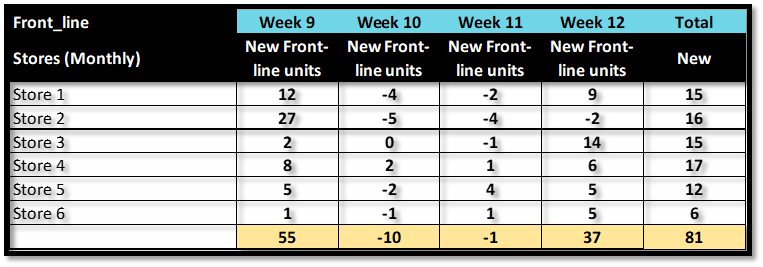
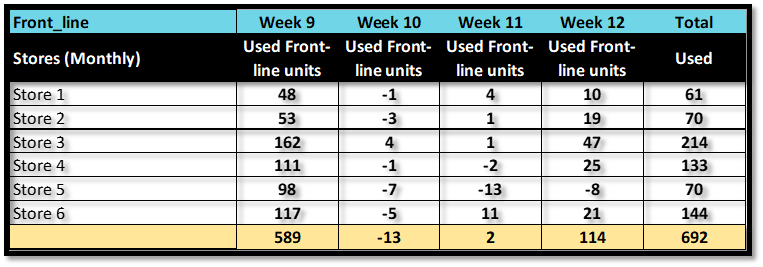
A frontline unit report is extremely important. At DTVMS we frequently go into consultations and discovery conversations, with decision makers who are adamant that they have a marketing deficiency or a marketing problem in their dealership, only to find out that the real issue is a disparity between inventory levels.
Marketing will only get you so far. You must understand the relationship between how many units you are selling vs how many units you are acquiring and how quickly you can get them to the frontline. This means strategy and fully understanding the nuances of inventory aging. If your replacement rate isn’t high enough, you’re going to quickly begin to see a deficiency of opportunity. You will not have enough inventory available for customers to engage with.
Same thing on the plus side. If you have a surplus of inventory, you may have more chances to sell a car, but you run into potential aging issues later. The average dealer has about 34 to 40% of his inventory in bronze category units. Those are units that sit 40+ days. Unless your focus is to stack ’em deep and sell ‘em cheap you have to be really careful
Remember the customer’s buying cycle is typically 30 to 90 days and post pandemic numbers put that closer to a hundred plus days. The amount of inventory you have available today matters, not just at the moment, but in terms of compounding strategies. If you’re not measuring the amount of inventory you have available to sell, not what’s on your website but what’s actually available to sell, then you’re not being fair to yourself, your vendors, or your salespeople.
INVENTORY MATTERS!
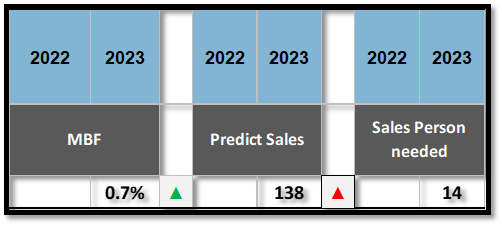
MBF Calculation
Here at DTVMS, we promote the MBF Calculation, which is a Jim Flint concept from his book “Car Dog Millionaire.” MBF essentially helps you to anticipate and predict your sales. If all things remain equal, meaning you have the same amount of inventory, marketing mix, spend, salespeople, and so on, then you are going to sell, relatively, the same number of cars every month.
It is highly, highly unlikely or improbable that if everything remained the same you would sell significantly less or significantly more units. Yes, there are market conditions to be considered and changes to the overall process–inventory mix has changed, pricing strategy has changed, personnel has changed, et cetera–but those would be considered things not remaining the same. So by taking a simple calculation you can not only anticipate your month, but enhance your strategy to change your outcomes. Change your status quo and get different results. MBF helps you know which things to change.
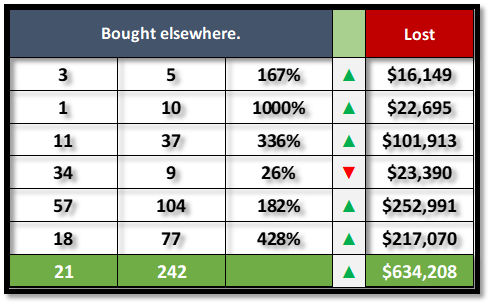
Lost Opportunities
It baffles me how little people look at lost opportunity data in their CRM. By not tracking this information on a weekly and monthly basis you are missing a key metric for understanding your teams’ strengths and weaknesses. These are data points entered into the system your dutiful employees managed to gather from customers willing to offer insights. This is the baseline. The bare minimum of information on a far larger occurrence.
What do we mean by that?
If you have four customers all looking at the same vehicle and the vehicle sells to one of them. Then you only have 25% of the data. If your agents manage to get a hold of one of the other three customers, and that customer tells you they bought from ABC Motors next door—you now have 50% of the picture.
You also have questions that can be asked and answered.
Why did Customer 2 buy across the street instead of at my dealership? Did we offer alternative vehicles? What are the excuses the sales associate involved has for not selling? How far in the process did they get before they left? Was the customer called immediately upon leaving the dealership? Or was it a week later?
Also, what about the other 50%? Are they still looking? Have we exhausted every chance to earn their business? Is there another car deal in those opportunities and they just have not been attended to properly?
Fully understanding the buying cycle of your customers will give you answers to the effectiveness of your entire process. From lead to follow to fixed ops retention. Data enables you the numerical power to make educated decisions and not emotional ones. By tracking your data, you create proactive sales opportunities that stabilize your variable operations.
You will begin to realize that digital analysis does a lot more than you think. It is a growth model, especially when you increase spend and you increase partners.
Adding more marketing dollars is not the answer! Dealers do not have a deficiency in leads and opportunities. They have plenty to do. They’re just focusing on the wrong to-do list.
Here’s a test.
Adding more marketing dollars is not the answer! Dealers do not have a deficiency in leads and opportunities. They have plenty to do. They’re just focusing on the wrong to-do list.
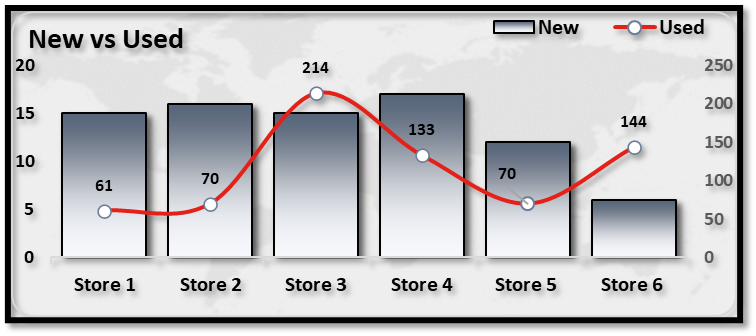
Here’s a test. Go into your CRM and GA and do a YOY comparison of visitors, unique visitors, leads, and, if you can, lead response times and appointment set, show, and sold rates. If your spending has remained the same, if there haven’t been any major changes to your operation, what you will notice is that the YOY comparison should look very similar (plus or minus 10%). This indicates that you can predict the number of units you are going to sell based on activity. Now, in this current landscape, we are noticing—with the stores we consult—that while activity levels are pretty much consistent, YOY sales began to decline around the second week of March 2023. We are seeing significantly less front-line available inventory in some stores, decreasing by up to 50%. This is the perfect example of why it is important to keep track of what you have for sale and what your drip rate is.
Marketing is often the first place we go to when searching to solve the concerns of the day when in reality, the majority of your opportunities for growth are inventory, people, and processes.
Herb Anderson/Charity Ann