

Car dealerships spend thousands of dollars every month on Google Ads, hoping these campaigns will drive more buyers to their lots and into their showrooms. But when the performance reports arrive, usually filled with charts, percentages, and acronyms, many dealers end up asking the same two questions: “Are these results good?” and “How do we really know?”
The truth is, the problem isn’t a lack of data. If anything, there’s too much of it. The bigger issue is that most of the numbers highlighted in Google Ads dashboards —such as impressions, clicks, and cost-per-click (CPC), don’t answer the one question every dealer cares about: Are these ads helping us sell more cars?
Let’s break down the standard metrics that often confuse dealers, what they mean, and, most importantly, which numbers you should be paying attention to if you want your ad spend to work more effectively.
1. Don’t Overvalue Clicks: CTR and CPC Aren’t Sales
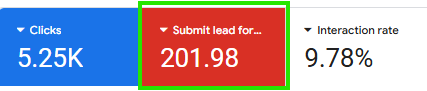
Clicks are not the same as conversions. A campaign might report a high click-through rate (CTR) or a low CPC, but if those clicks never translate into test drives, showroom visits, or signed paperwork, they’re just worthless.
A good CTR varies and usually looks like this:
- Search Ads (Automotive For Sale): ~8.29% average CTR (2025, WordStream/LocaliQ dataset covering Apr 2024–Mar 2025). WordStream
- Vehicle ads: No universal CTR benchmark is published by Google. Treat them as a lower-funnel, feed-driven format delivered via Performance Max with vehicle feeds and evaluate on VDP clicks/views and downstream leads, not raw CTR. Google Support.
- Display Ads: ~0.46% CTR on the Google Display Network. WordStream
On paper, these campaign metrics can be misleading. Remember that efficiency does not necessarily equal profitability. Paying $1 per click that leads nowhere is far worse than paying $3 for a click that results in a booked appointment. CTR and CPC can help you understand whether your ads are being delivered effectively, but they don’t prove success.
2. What to Track Instead: CPA and CVR
For clarity, focus on tracking Cost Per Acquisition (CPA) and Conversion Rate (CVR). Important note: in Google Ads, CPA = cost per action/conversion (whatever you defined as the action). If your action is a lead, then you’re effectively talking about CPL (cost per lead). Use CPL when you’re comparing to published lead benchmarks; use CPA if your action is something else (e.g., store visit, sale). Google Support
Benchmarks for automotive campaigns look like this:
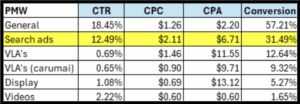
- Search Ads (Automotive For Sale, Apr 2024–Mar 2025): CPC $2.41 | CTR 8.29% | CVR 7.76% | CPL $38.86. WordStream
- Vehicle ads: Evaluate using cost per VDP view, VDP-to-lead rate, and lead/store-visit quality. Google documents Vehicle ads as a lower-funnel format that routes clicks to your VDP and runs via Performance Max with vehicle feeds; Google does not publish universal CTR/CPA/CVR benchmarks for this format. Google Support
- Display Ads: Current automotive CPA/CVR benchmark. Use your own baselines; historically, GDN CTR ≈ 0.46% cross-industry. WordStream
Make sure to inspect what you expect. At DTVMS we track our clients’ benchmarks daily so we can make adjustments quickly based on data that matters.
3. Vehicle Listing Ads Work Differently
Many dealers mistakenly judge Vehicle Ads (often called VLAs) by CTR or CPC, but these are not standard “text search ads.” The format is delivered via Performance Max with a vehicle feed and can show on Search and other Google surfaces. A click takes the shopper to your Vehicle Detail Page (VDP), so the better way to evaluate performance is by measuring:
- Vehicle Detail Page (VDP) views
- Cost per VDP view
- Lead-to-sale ratio from VDPs
- Local intent signals where eligible (e.g., Google-tracked Local actions like Directions and Calls, and Store Visits if your account qualifies) Google Support+1
To gain even more accurate insights, segment your inventory rather than lumping it all together. Look at:
- New vs. Used
- On-brand vs. Off-brand
- Fresh vs. Aged (45+ days) inventory
- Trucks vs. SUVs vs. Sedans
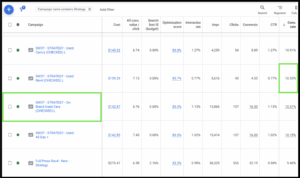
This way, you’ll know exactly which types of vehicles your ads are moving, and which ones are getting ignored. Google Support
4. Don’t Let Automation Take Over
Google’s Performance Max (P-Max) campaigns can be useful, but many dealers fall into the trap of letting automation run unchecked. The risk of this approach is that it can lead to budget waste without yielding any meaningful results. Also, common pitfalls you should avoid include:
- Overly broad geo-targeting that wastes spend on irrelevant markets
- Duplicate or irrelevant audience signals that confuse the algorithm
- Feed errors that reduce visibility in search results
- Tracking weak actions (like “time on site”) as conversions
What Google confirms: P-Max is goal-based automation and may show ads beyond your audience signals if it predicts conversions, so clean conversion goals and guardrails matter. Google Support
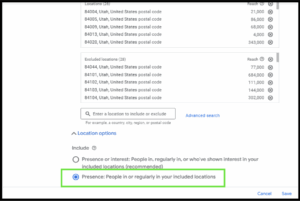
Actionable guardrail for local dealers: In Location options (advanced), understand the difference between “Presence” versus “Presence or interest (default)”. Choosing Presence restricts delivery to users actually in your market; “Presence or interest” can broaden reach outside your area. Pick the option that aligns with your intent and test. Google Support
The solution to this is simple: stay in control. Tighten your location settings, clean up your inventory feed, and only track conversions that have real value to your dealership.
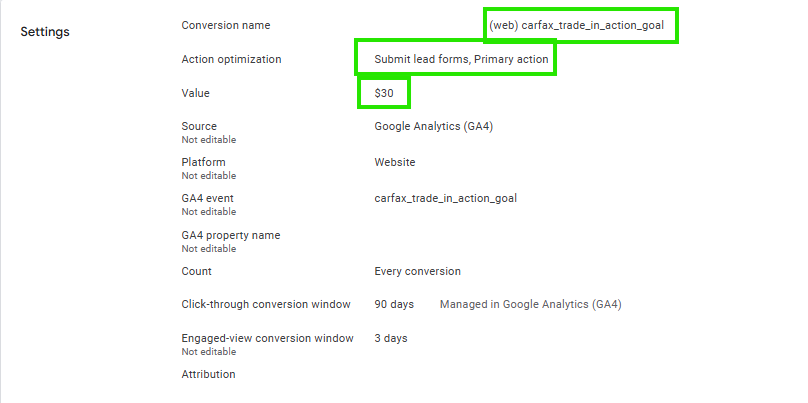
5. Fix Your Conversion Tracking
This is where many dealerships go wrong. Too often, everything is counted as a conversion, such as page scrolls, video views, form starts, or time spent on the site. These inflate results and create a false sense of success.
Instead, you should only count real business actions, such as:
- Completed forms
- Phone calls counted at a minimum duration you set (e.g., 30 seconds) (Google counts a call conversion when it exceeds the minimum length you choose) Google Support
- Booked appointments
- Completed credit applications
And don’t stop there, assign actual dollar values to each action. For example:
- Credit application = $150
- Form lead = $75
- Soft lead (chat inquiry) = $25
In Google Ads, mark revenue-driving actions as Primary (used for bidding) and keep the rest as Secondary (for reporting). If you assign values to primary conversions, you can use value-based bidding. Google Support+2Google Support+2
By feeding these values back into Google Ads, the system learns to prioritize high-value leads rather than waste its budget on low-value actions.
6. Track the Whole Funnel, Not Just Ads
Even the best ads can fail if the sales process on the ground is broken. That’s why it’s essential to measure the entire funnel from the first click to the final sale.
Industry benchmarks suggest:
- New vehicles (Internet + Phone) — Contact 63%, Appointment Set 42% (of contacted), Show 58% (of appointments), Close 41% (of shows). Foureyes
- Used vehicles (Internet + Phone) — Contact 67%, Appointment Set 48% (of contacted), Show 54% (of appointments), Close 40% (of shows). Foureyes
Latest cut (Q4 2024–Apr 2025) – appointment set rate: Internet ~40–42% vs. Phone ~74–80%, with used consistently higher than new—helpful for channel handling expectations. Foureyes
If your ads generate a high volume of leads but sales numbers remain stagnant, the issue may not be the campaign itself; it could be how your team handles the leads.

If your ads generate a high volume of leads but sales numbers remain stagnant, the issue may not be the campaign itself; it could be how your team handles the leads.
7. A Simple Scorecard for Dealers
Here’s a quick reference scorecard to cut through the noise:
- CTR: ~8.29% (Search, Automotive For Sale); Vehicle ads: no universal CTR benchmark (judge via VDP views/cost per VDP and downstream outcomes); Display: ~0.46% CTR (cross-industry, historical). WordStream+2Google Support+2
- CPC: ~$2.41 (Search, Automotive For Sale). WordStream
- CVR: ~7.76% (Search, Automotive For Sale); Vehicle ads: judge by VDP-to-lead and lead/store-visit quality. WordStream+1
- CPL (cost per lead): ~$38.86 (Search, Automotive For Sale). (Use CPL when the action is a lead; reserve CPA for other actions.) WordStream+1
- Funnel benchmarks: New (63% → 42% → 58% → 41%); Used (67% → 48% → 54% → 40%); Q4’24–Apr’25 set rates: Internet ~40–42% vs Phone ~74–80%. Foureyes+1
Source: WordStream/LocaliQ 2025 Google & Microsoft Ads benchmarks (Automotive For Sale), Google Merchant Center Vehicle ads overview, Google Ads Help (conversions & value-based bidding), and Foureyes dealership sales-process benchmarks (H2-2023 and Q4’24–Apr’25).
Use this framework in conjunction with inventory levels, customer intent, and location-specific data to gain a comprehensive view.
Focus on Outcomes
Clicks don’t sell cars. Leads and sales do. Too many dealerships get distracted by chasing cheap clicks or celebrating high impressions. However, the smarter approach is to build solid conversion tracking, assign value to every type of lead, and measure results throughout the entire funnel, from the initial search to the final conversion.
When you track the right numbers, you stop wasting budget and start creating a system where your advertising spend works for you instead of against you. And that’s when Google Ads transforms from a confusing expense into a predictable engine for growth.
— Herb Anderson
Source notes (for your LinkedIn readers who ask)
- WordStream/LocaliQ 2025 Google Ads Benchmarks (Automotive—For Sale) — CTR 8.29%, CPC $2.41, CVR 7.76%, CPL $38.86 (Apr 2024–Mar 2025 dataset). WordStream
- Google Merchant Center — Vehicle ads overview (lower-funnel, P-Max with vehicle feeds; click goes to VDP). Google Support
- Performance Max audience signals — may expand beyond your signals when likely to convert. Google Support
- Location options (advanced) — Presence vs Presence or interest. Google Support
- Phone call conversions — conversion counts when call exceeds the minimum length you set. Google Support
- Primary vs Secondary conversions; value-based bidding; set conversion values. Google Support+2Google Support+2
- Offline conversions / Enhanced Conversions for Leads. Google Support
- Foureyes H2-2023 sales-process benchmarks and Q4’24–Apr’25 appointment-set rates. Foureyes+1
- Historical Display CTR (~0.46%) — legacy cross-industry GDN benchmark. WordStream